The Morning the Unexpected Demand Notice Arrived for Section 161 GST Rectification
Section 161 GST Rectification became the single most critical legal phrase in Aarav Sharma's life on a crisp Tuesday morning in October. As the founder of Zenith Logistics—a mid-sized fleet management company based out of Pune— Aarav had spent seven years meticulously building his business. His desk was typically covered with route maps and fuel receipts, but today it held a single piece of paper bearing the daunting crest of the Central Goods and Services Tax department.
The document was an assessment order passed under Section 73 of the CGST Act. The bottom line was staggering: a tax demand of ₹45,50,000, accompanied by an equal penalty. Aarav felt his stomach drop. His total tax liability for the financial year had been a mere ₹4,55,000, which Zenith Logistics had paid in full three months prior.
Aarav immediately called his senior tax consultant, Meera Deshmukh. Within forty-five minutes, Meera was sitting across from him, reviewing the order with a sharp, practised eye. Within seconds, her forehead unwrinkled, and a calm smile appeared on her face.
"Look right here, Aarav," Meera said, pointing her pen at paragraph 4 of the order. "The Assessing Officer typed ₹45,50,000 instead of ₹4,55,000. It’s an extra zero added inadvertently during final drafting. This is a classic clerical slip on the face of the record."
Panicked, Aarav asked, "Do we have to file an expensive appeal before the Appellate Authority under Section 107? That will take months and tie up 10% pre-deposit funds!"
"Not at all," Meera replied confidently. "We don't need a lengthy appeal for an obvious slip. We will invoke Section 161 GST Rectification to fix this immediately."
Assessment Order 2. Section 161 Application 3. Rectified DRC-08 (Extra zero added) (Filed within 3 months) (Revised demand)
Demystifying Section 161 GST Rectification
As Meera explained the law over tea, Aarav learned that the Central Goods and Services Tax Act contains built-in safeguards against administrative oversight. Section 161 GST Rectification gives statutory authority to any tax office to correct mistakes that are self-evident from the record itself.
"The law recognises that tax officers are human," Meera noted. "Whether it is an arithmetic oversight, a typographical error, or an accidental omission of a document already submitted on portal records, Section 161 allows the issuing authority to rectify its own order without sending the taxpayer through a gruelling litigation process."
To understand official statutory directives, refer directly to the CBIC Tax Repository Portal for authoritative notifications on statutory compliance under the CGST Act.
What Qualifies as an "Error Apparent on the Face of Record"?
Not every mistake can be handled via Section 161 GST Rectification. Jurisprudential rulings have clearly defined the boundaries of what constitutes an "error apparent on the face of the record."
Key Legal Test for Section 161 GST Rectification:
An error is "apparent on the face of record" if it is plain, manifest, and capable of being identified immediately without long-drawn arguments, complex legal debates, or fresh factual investigations. If proving the mistake requires extensive new testimony or alternative legal interpretations, it falls outside Section 161.
Meera broke down the distinction between rectifiable errors and non-rectifiable disputes for Aarav using a clear taxonomy:
Category of Mistake
Qualifies for Section 161 GST Rectification?
Real-World Example
Arithmetical Slip
YES
Total tax calculation showing ₹ 10,00,000 instead of ₹ 1,00,000 due to addition errors.
Clerical / Typo Error
YES
Inadvertently entering an incorrect GSTIN or wrong financial year (e.g., FY 2021-22 instead of 2022-23).
Ignored Material Record
YES
Tax officer missing a GSTR-3B return copy that was already uploaded and attached prior to order.
Debatable Legal Question
NO (Requires Appeal)
Disputing whether a service qualifies as a "composite supply" vs "mixed supply".
Fresh Evidence/New Facts
NO (Requires Appeal)
Submitting new vendor confirmation letters that were never part of the original proceedings.
For detailed precedent analysis on tax rectifications, legal researchers often consult comprehensive legal repositories like TaxGuru Section 161 Analysis.
Time Limits & Critical Statutory Windows for Section 161 GSTRectification
Time is of the essence when utilising Section 161 GST Rectification. The legislature created strict timelines to ensure finality in administrative tax proceedings while granting sufficient time for correction.
Taxpayer Application Window: An affected taxpayer must submit an application for rectification within 3 months from the date of issuance of the order or notice.
Officer Suo-Moto Limitation: The issuing officer can rectify the order on their own initiative (suo-moto) within 6 months from the issue date
Section 161 GST Rectification vs. Filing an Appeal
Aarav asked the question every business owner faces in a tax dispute: "Why don't we just file an appeal to be completely safe?" Meera highlighted why Section 161 GST Rectification is far superior when an error is obvious.
Parameter
Section 161 GST Rectification
Section 107 Statutory Appeal
Forum / Authority
Same Officer who passed the order; higher appellate
Higher Appellate Authority
Mandatory Pre-Deposit
NIL (₹0)
10% of disputed tax demand
Average Resolution Time
15 to 45 Days 8 to
8 to 18 Months
Legal & Professional Costs
Minimal Substantial
Substantial (Litigation fees)
Scope of Review
Limited strictly to apparent mistakes
Wide review of facts and law
Step-by-Step Filing Strategy for Section 161
To ensure Zenith Logistics obtained swift relief, Meera mapped out a 4-step execution strategy for their Section 161 GST Rectification application:
Step 1: Document Gathering & Error Identification
They extracted the filed GSTR-3B return, the electronic cash ledger summary, and the impugned assessment order. They highlighted the exact clause where ₹4,55,000 was miscopied as ₹45,50,000.
Step 2: Drafting the Rectification Application
Meera drafted a concise application clearly titled "Application under Section 161 for Rectification of Error Apparent on the Face of Record." The draft emphasised that no new facts were being introduced and that the mistake was purely mathematical.
Step 3: Portal Submission & DRC-08 Tracking
The application was uploaded via the GST Common Portal under Services > User Services > Application for Rectification. Upon submission, the portal generated a unique Application Reference Number (ARN).
Step 4: Adherence to Natural Justice
Under Section 161, if a proposed rectification adversely affects any person, the authority must issue a notice and grant an opportunity of being heard. However, since Zenith’s application reduced tax liability, the officer could approve it smoothly without adversarial proceedings.
The Final Resolution & Victory for Zenith Logistics
Three weeks after submitting the online petition, Aarav received an email alert from the GST Portal. The proper officer had reviewed the application, cross-referenced the electronic ledger, and acknowledged the mathematical transposition error. The officer issued a rectified order in Form GST DRC-08, officially reducing the demand from ₹45,50,000 back to the correct amount of ₹4,55,000. Because Zenith Logistics had already paid ₹4,55,000 months prior, the net demand was updated to NIL. Aarav stepped out into the Pune sunlight with immense relief. What could have been a multi-year legal battle with locked capital was resolved in under a month without stepping foot into a courtroom—all thanks to the swift application of Section 161 GST Rectification.
Key Strategic Takeaways for Taxpayers
Every business owner, accountant, and tax professional should keep these core principles in mind when dealing with erroneous tax notices:
Act Immediately: Review every tax order upon receipt. You have a 3-month window to file a Section 161 application.
Verify the Nature of Error: Ensure the mistake is patent and self-evident from the existing record without needing new documents.
Do Not Conflate Review with Rectification: Section 161 cannot be used to re-argue a lost legal dispute or reevaluate evidence.
Monitor Appeal Deadlines: If the 3-month appeal window is closing and the officer has not acted on your rectification application, consider filing a protective appeal under Section 107.
The rich-life illusion in an Indian tier-3 city: Creta next door isn't wealth. It's a 7-year EMI with a depreciation clock. Here's the correct comparison – and the quiet luxury index for tier-3 India.
Disclaimer: This article contains affiliate links to investment platforms such as Zerodha and Dhan. We are not SEBI-registered advisors; please consult a qualified financial professional.
The Comparison That Made Me Feel Poor When I Wasn't A Rich Life Illusion
My neighbour bought a new Hyundai Creta in March.
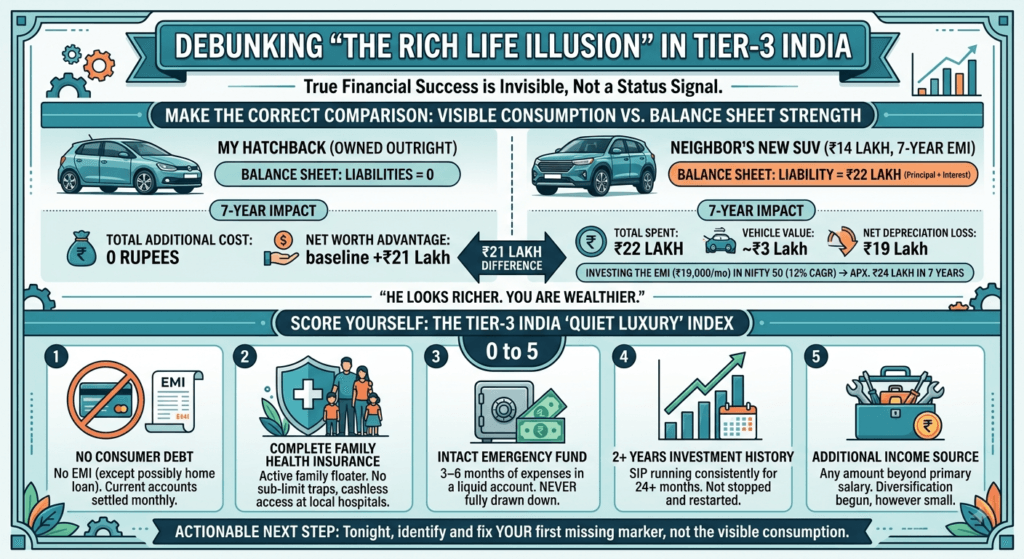
14 lakh rupees ex-showroom. Seven-year loan at approximately 9% interest—monthly EMI: approximately 19,000 rupees.
For approximately two weeks after the Creta appeared in the shared parking, I had a persistent low-grade feeling of financial inadequacy.
My own vehicle -- a 2017 hatchback owned outright -- looked older by comparison. The visible gap in consumption felt like a gap in financial standing.
Then I ran the actual comparison. Not consumption versus consumption -- that comparison is what produces the inadequacy feeling. Balance sheet versus balance sheet -- which is the comparison that tells the truth.
"The feeling of being less wealthy and the reality of having less wealth are two completely different things. One is produced by visible consumption comparison. The other requires a balance sheet."
The Creta Balance Sheet — The Number Most People Never Run — which is a rich-life illusion.
ITEM
CRETA BUYER (7-YEAR EMI)
MY HATCHBACK (OWNED)
Monthly outflow
Rs 19,000 EMI
Rs. 0 (running cost only)
Total paid over 7 years
~Rs 22 L (purchase + interest)
Rs. 0 additional capital outlay
Vehicle value at year 7
~Rs 3-4 Lakh
~ Rs 1 Lakh (older)
Net asset created
Rs 3-4 L from Rs 22 L spent
Rs. 0 additional expense
EMI capital invested in Nifty 50 instead
N/A
Rs 24 L is the same monthly amount for 7 yr, 12% CAGR
Net worth difference at year 7
Baseline
+ Rs 21-22 L advantage
The table's most important row: if the Rs 19,000 monthly EMI were instead directed to a Nifty 50 SIP for 7 years at 12% CAGR, the terminal value would be approximately Rs 24 lakh. The vehicle's value at the same point: approximately Rs 3 lakh.
The wealth difference between the two approaches, measured at the 7-year mark: approximately Rs 21 lakh. This is not an argument against car purchases. Cars serve real purposes: reliability, safety, productivity, family transport, professional credibility.
The Creta is a sensible family vehicle. The argument is against using the visible quality of someone else's car as a proxy for their wealth. The Creta signals income and expenditure.
It says nothing about net worth, emergency fund, investment history, or insurance coverage.
Why Visible Consumption Is poor wealth compared to rich life Illusion Proxy in India
Thorstein Veblen's concept of conspicuous consumption -- spending to signal status -- was developed in the context of a society where the wealthy could afford to signal status and the non-wealthy could not. The signal had content: visible consumption implied underlying wealth.
Consumer credit has largely invalidated this relationship. EMI financing means that the visible consumption signal can be purchased on credit by anyone with a stable income -- regardless of their actual wealth position.
The person with a new SUV on a 7-year EMI and no emergency fund is making a different financial choice than the person with a paid-off older vehicle and a growing SIP portfolio.
But from the street, they are indistinguishable -- and from the street comparison, the SUV owner appears wealthier.
In tier-3 India specifically, where consumer credit has expanded significantly in the last decade, investment culture has grown more slowly, widening the gap between visible consumption and actual wealth.
The position is particularly wide. The neighbourhood's newest vehicles frequently represent the highest debt loads, not the highest net worths
If that same ₹19,000 monthly outflow were redirected into an index fund via platforms like Zerodha or Dhan, it would grow into approximately ₹24 lakh at a 12% CAGR over 7 years.
The Rich Life Illusion: Quiet Luxury Index — Five Markers for Tier-3 India
Quiet luxury, in the global personal finance context, refers to the wealth signals invisible to casual observation. In tier-3 India, those signals are specific:
MARKER
WAHTIT LOOK LIKE
WHAT IT SIGNALS
1. No consumer debt
Zero EMIs (except possibly a home loan); credit card balances cleared monthly
Positive cash flow without consumption leverage.
2. Family health insurance
Active family floater or individual policy with no sub-limit traps or gaps.
Medical emergencies will not wipe out accumulated capital.
3. Emergency fund intact
3–6 months of living expenses in a liquid account, never fully drawn down.
Short-term financial shocks are absorbed without resorting to debt.
4.2+ years investment history
SIP running consistently for 24+ consecutive months.
Active compounding and established financial discipline.
5. One additional income source
At least one additional income stream beyond the primary salary, however small.
Early diversification and reduced single-employer dependency.
Score 0 to 5 -- one point per confirmed marker.
SCORE
POSITION
PRIORITY ACTION
0
Financial foundation not yet started
Start emergency fund first — any amount
1
Beginning — one foundational element in place
Health insurance if missing; emergency fund if no insurance
2
Building — two elements established
Their marker — usually consistent investment history
3
Stable foundation
Fourth or fifth marker — usually additional income or extended emergency fund
4
Strong foundation
Optimise existing — increase SIP, extend emergency fund to 6 months
5
Tier-3 quiet luxury position
Maintain and compound — the foundation is established
The Creator's Score — Honest Accounting for rich life Illusion
At the time of the Creta comparison, my quiet luxury score was 3.
Marker 1 — No consumer debt: yes. No EMI, no credit card balance.
Marker 2 — Health insurance: partial. Individual policy in place, but not a family floater.
Marker 3 — Emergency fund intact: yes. Four months of expenses, not drawn down.
Marker 5 — Additional income: early stage. DareMinds' income is beginning but not yet stable.
My estimated score for the Creta neighbour: 1 to 2. Income: yes (one point by definition). Emergency fund: Uncertain -- the Rs 19,000 monthly EMI significantly constrains emergency fund building.
Health insurance: unknown. No consumer debt: no -- the Creta loan is consumer debt. The feeling is that he is wealthier. The score: I am in a stronger position. The Creta is a consumption signal, not a wealth signal.
Recalibrating the Reference Group for the rich life Illusion
The quiet luxury score is useful beyond its function as a self-assessment tool.
It provides a recalibrated reference group -- a way to compare financial positions against dimensions that actually predict long-term wealth rather than current consumption visibility.
The NSSO and PLFS data on Indian household income and wealth distribution provide the broader Context:
Monthly Household Income
Approximate Income Percentage
Context
< Rs 10,000
< 40th percentile
Below median — majority of Indian households
Rs 20,000
~65th percentile
Above median
Rs 30,000
~75th percentile
Top quarter
Rs 50,000
~88th percentile
Top 12%
Rs 100,000
~95th percentile Top
Top 5%
The reference group visible on social media and in professional networks is not representative of India's income distribution. LinkedIn's feed is populated by the top 5 to 10% of earners -- the Rs 1 lakh+ households.
The neighbour's Creta represents the top 12 to 15% of households by income. Comparing one's financial position to these visible reference points and feeling inadequate is comparing against a systematically unrepresentative sample.
The percentile look-up -- available through NSSO data -- provides the accurate comparison: at Rs With a Rs 30,000/month household income, you are in the top quarter of Indian households by income.
The Creta: The comparison is between one top-quarter household and another.
Neither is 'rich' by global standards. Both are in a strong position by Indian standards. The EMI structure of one does not make it wealthier than the other.
What is your quiet luxury score tonight as a rich-life illusion?
Five questions. One point each.
Is your current financial position free of consumer debt (no EMIs except possibly a home loan)?
Do you have health insurance covering yourself and any dependants, currently active, with no significant gap?
Do you have an emergency fund of at least 3 months of expenses that has not been emptied in the last 12 months?
Have you had a consistent investment (SIP or equivalent) running for at least 24 months without stopping?
Do you have any income source beyond your primary salary, however small?
Write your score. The first missing marker is your next financial action. Not the Creta. The marker.
If comparison anxiety is keeping you awake, use the 5-minute financial dump from Why You Wake Up at 3 AM or apply the tactile sleep protocols from Military Sleep Method to clear active memory before bed.
Why the Global Quiet Luxury Framework Doesn't Transfer
The global quiet luxury trend in fashion and lifestyle media describes expensive goods designed without clear branding. This includes understated cashmere, logo-free leather items, and high-quality fabrics and craftsmanship that only signal wealth to those who understand the cues.
This idea assumes that you start with significant wealth. The only question left is whether to show that wealth loudly or quietly. This does not apply well to a tier-3 Indian salaried context. There, the more important question isn't how to display wealth subtly. Instead, it’s about which financial indicators genuinely show security. These markers relate to balance sheet structure, not aesthetic choices.
The version of quiet luxury that matters in tier-3 India isn't about choosing subtlety over visibility. It focuses on five markers that are invisible by nature, not by stylistic choice.
The Five Structural Markers for Quiet Luxury in India
Marker-
Zero consumer debt | Complete health insurance | Intact emergency fund | 2+ years of continuous investment | One additional income source
What it requires
No EMI except possibly a home loan. | Family coverage, no sub-limit traps | 3–6 months expenses, never fully drawn | Running without interruption, not stopping | Any amount, however small, beyond primary
Why it's structurally important
Consumer debt turns future income into a present obligation. | A medical event can wipe out years of saved progress. | Determines whether a shock requires debt or can be managed without it. | Any break resets the compounding clock. | Reduces reliance on a single point of failure.
Each marker is clear and can be verified; there is no doubt in scoring it. This is different from the more subjective question of whether a specific purchase shows tasteful subtlety or excessive display. This clarity makes the index useful for honest self-assessment rather than another way to compare socially.
Why These Specific Five quiet luxury India markers, and Not Others
The five markers were chosen because each one addresses a different type of financial vulnerability. Together, they cover the most common ways a financially stable household can become unstable.
Consumer debt (Marker 1) turns future income into current obligations. This limits flexibility for every financial decision while the debt remains. A household with a lot of consumer debt is less able to handle other unexpected shocks since a significant portion of monthly income is already committed before handling discretionary or emergency expenses.
Health insurance gaps (Marker 2) represent a rare but severe risk. When this risk becomes reality, it can wipe out years of financial progress in one incident. This risk is precisely the type that even a well-managed financial situation can overlook if this marker is ignored.
An emergency fund (Marker 3) acts as a buffer. It determines whether a moderate, foreseeable shock like a vehicle repair, a short income gap, or a moderate medical expense leads to new debt or can be managed with existing reserves. The presence or absence of this fund decides if a bad month turns into a permanent setback or a temporary issue that can be fully recovered from.
Continuous investment history (Marker 4) shows the compounding principle discussed in the DareMinds financial content. When a systematic investment plan is interrupted, it doesn’t just pause; it sets back a significant part of the compounding process. The missed contributions during this interruption lose all subsequent years of growth, not just the growth that would have occurred during the interruption.
A second income source (Marker 5) helps manage the risk of depending on one income. A household that relies only on a single income source faces a significant risk with any disruption to that income, such as a job loss, a long illness, or organisational restructuring, with no backup plan in place.
Quiet Luxury in India: Scoring Yourself — and Why Visible Wealth Often Scores Lower
Score zero to five, earning one point for each marker confirmed. The scoring is all or nothing for each marker; either it meets the requirement fully, or it does not. There is no partial credit. Partial health insurance coverage or a partially funded emergency fund still leaves the underlying vulnerability largely unchanged.
The surprising finding when this index is applied honestly across different households is that visible consumption levels show only a weak link to the actual score. A household with a new vehicle on a seven-year loan, brand-name electronics, and a seemingly higher standard of living often scores just 1 or 2. This is because the loan obligation (failing Marker 1) often pairs with an underfunded emergency reserve (failing Marker 3) and limited capacity for continuous investment (failing Marker 4). The visible spending has absorbed the financial capacity that could have supported these key markers.
On the other hand, a household with an older vehicle and a modest visible standard of living may remain debt-free, be fully insured, have a solid emergency fund, and have a history of continuous investment. This household may score a 4 or 5, despite appearing less wealthy in terms of visible consumption than the comparison household.
The Resilience Test — Why the Score Predicts Outcomes Better Than Visible quiet luxury Indian markers
The real value of this index shows up when tested against a realistic financial shock: an unexpected expense of Rs 40,000, which can come from a medical issue, a vehicle repair, or an urgent home repair.
Household profile
New SUV on EMI, no insurance gap awareness | Full emergency fund
Score
No emergency fund requires high-interest debt (credit card or personal loan) to cover. Older vehicle | Continues to be absorbed from emergency fund
Response to Rs 40,000 shock
Complete insurance | SIP continues uninterrupted
What determines which of these two outcomes occurs is the score, not the level of visible consumption. This is the case for treating the index as the real target to optimise. It predicts resilience to the financial shocks that all households, sooner or later, face far more reliably than visible standard of living.
The Progression — Up One Point at a Time
Score 0–1:
Before any increase in your SIP or any additional investment, your emergency fund takes precedence. The one thing that best predicts avoiding a single bad month that spirals into a multi-year debt spiral is an emergency fund, and the absence of it nullifies any other financial progress made at the same time.
Score 2-3:
The next-highest-leverage marker is generally health insurance review. A coverage gap is a low-probability event, which is precisely why it is likely to be deprioritised – the lack of any recent bad outcome gives a false impression of the gap not being urgent when, in fact, its severity when it does materialise justifies addressing it before lower-severity, higher-visibility priorities.
Score 4:
Last and slowest marker to be established. The second income source is generally the last and slowest marker to be established. This is the specific argument for starting it immediately rather than waiting for a more convenient moment — the multi-month or multi-year timeline of establishing even a modest second income stream means that delay has a direct, calculable opportunity cost in the same way that delaying a SIP does.
Your Score Tonight
Now, give yourself an honest score on all five markers.
Identify your lowest scoring marker. That marker—not the next purchase, not a SIP increase, not anything else—is tonight’s real financial priority, because it’s the biggest remaining structural vulnerability in an otherwise functioning financial life.
Not listed with SEBI. All calculations are for illustration purposes only. For professional advice tailored to your particular circumstances, you should consult a qualified professional.
Panic selling is the real crash in the Bombay Stock Exchange, which lost ₹300,000 crore in market capitalisation during a single trading session in April 2026. Financial news channels displayed this figure in red for three days. Retail investors across India opened their portfolio apps within hours and asked the same question: Should I sell?
The answer, backed by every available data point from all past corrections in Nifty 50 history, is 'no'. However, understanding the reasons behind this—grasping what actually happened and how financially savvy investors act differently—is the more valuable lesson.
What Actually Caused the Crash
The crash was not caused by the Iran War. This distinction is important. The escalation of the Iran war triggered the reaction. The real mechanism that turned a geopolitical event into a ₹3 lakh crore market event was the combined behavioural response of millions of investors acting at the same time, in which panic selling increased it rapidly.
Here's what happened: Iran war headlines broke at 9:15 am. Foreign institutional investors, responding to global risk signals, began selling Indian positions to invest in the relatively safe US treasuries. Domestic retail investors logged into their apps at 9:30 AM, saw a sea of red, and started selling. This selling pressure triggered algorithmic stop-loss orders—computer programs meant to automatically sell positions when prices drop below a certain level. This automation heightened the panic among retail investors, leading to a chain reaction.
The market is not just a financial tool. It reflects real-time human fear. And fear, as any researcher understands, isn't always a reliable indicator.
The Discount Misread as Loss
This is what sets apart the top 1% of investors who consistently grow their wealth from the majority who don’t. If your SIP NAV drops the day after a crash, it's not a loss. It's a discount.
A loss means you have to sell. If you don't sell your units at a lower price than what you paid, the decrease in NAV is simply a change in paper value—not a change in your actual financial standing. The units are still there. They still represent a share in the same Nifty 50 companies, which still have the same assets, earnings potential, and long-term prospects.
The key takeaway is this: when the Nifty falls by 5% due to panic selling, each SIP debit during this time buys units at prices that are 5% lower. Over an investment period of 18 to 26 years, these discounted units drive returns that outperform the investor who took a break.
An investor who panicked and sold during the ₹3 lakh crore crash turned a paper discount into a real loss. In contrast, the investor who held on—whose SIP continued on schedule—purchased at a discount and is set to benefit from the recovery.
The Behavioral Structure That Makes This Possible
Understanding the mechanism isn’t enough. An investor under emotional stress, watching their portfolio drop in real time, doesn't think about mechanisms. They feel fear and react to it.
The difference between an investor who holds and one who sells isn’t about emotional strength. It's about having structural safeguards in place.
Auto-debit:
When the SIP is set to automatically deduct on a fixed date, there’s no decision to be made during a crash. The SIP proceeds because that decision was made ahead of time in a calm moment before the crash hit. This protects the panic-stricken you from making poor choices.
Emergency fund:
An investor with six months of living expenses saved does not need to sell their investments to cover unexpected costs. An emergency fund removes the pressure that can lead to selling during a downturn. Without it, a personal crisis in a market slump can create a painful cycle: selling at the worst moment because there are no other options.
No market apps on the home screen: Checking your portfolio during a crash increases stress levels. High stress levels can cloud judgement. By removing the temptation to check, you eliminate the trigger for that stress. This isn't about avoiding reality—it's about having protective measures in place.
What This Means for Your Situation
If you held through the crash in April 2026—if your SIP continued on schedule and you didn’t sell—you accomplished one of the most challenging tasks in retail investing. Acknowledge that.
If you paused your SIP or sold, take stock of the costs. It’s not about punishing yourself. It’s to learn from this experience so you can equip your future self for the next market downturn.
Another correction will inevitably come. It may have a different name—a different war, virus, or trade conflict—but the mechanics will remain the same. The lessons from this correction will help you prepare.
For the full SIP setup guide, visitdareminds.com/how-to-start-sip Start SIP today withDhan — set it up in under 10 minutes from ₹100/month. Or Zerodha for direct plan access.
Affiliate disclosure: I earn a small commission at no cost to you. This does not influence my recommendations.
Not SEBI registered. Personal financial documentation only. Please consult a qualified professional before investing. Not SEBI registered. All content documents personal financial decisions only. Consult a qualified professional before investing. Affiliate disclosure: commission earned at no cost to the reader.
Disclosure: This post contains affiliate links. If you sign up through my links, I may earn a small commission at no extra cost to you. I only recommend products I use or have thoroughly researched. My commission does not affect your returns or the product's cost.
How to Start SIP in India: A Beginner's Honest Guide
In October 2022, I lost ₹80,000 in F&O trading. That was 2.5 months of my salary, gone in one quarter. That loss pushed me to finally explore the one investment method I had been ignoring for three years: SIP. What I discovered changed everything.
What Is a SIP and Why Does It Actually Work?
SIP stands for Systematic Investment Plan. It isn't a product to buy; it’s a method of investing. You choose a mutual fund, decide on an amount (as low as ₹100), and set a date. Every month, that amount is automatically debited from your account and invested. There’s no need to time the market or check the Sensex every morning. It’s just consistent, automatic investing.
The strength of SIP comes from compounding and rupee cost averaging.
When markets fall, your fixed amount buys more units. When markets rise, the units you already own increase in value. Over 10 to 20 years, this averaging effect reduces the volatility that lump-sum investing cannot. According to AMFI data on active SIP accounts in India, over 8.9 crore SIP accounts are active, yet India's working population is over 50 crore. Many people still haven't started.
I was one of them for three years. Read about how my sleepless night after losing a huge chunk and how it came out to be. That loss finally motivated me to fully understand SIP in India.
How to Start SIP in India: 4 Steps to Your First Investment
Here is the exact process I followed. It took me under 20 minutes once I stopped overthinking.
Step 1: Choose Your Platform
Use a SEBI-registered direct mutual fund platform. I personally use Dhan and Zerodha Coin. Direct plans mean no distributor commission, so the money that would go to an agent stays in your portfolio. You can start your SIP on Dhan for just ₹100 (affiliate link—I earn a small commission) or open a Zerodha account to invest in mutual funds directly (affiliate link—I earn a small commission). Both are reliable, regulated platforms.
Step 2: Complete Your KYC
KYC (Know Your Customer) is mandatory and a one-time process. You need your Aadhaar, PAN card, and a quick selfie. On Dhan, this takes about 10 minutes. On Zerodha, it’s similar. Do not skip this step—without KYC, you cannot invest anywhere in India. According to SEBI guidelines on mutual fund direct plans, KYC compliance is necessary for all mutual fund investors.
Step 3: Pick Your Fund
If you are a beginner, don't spend weeks comparing funds. Start with a Nifty 50 index fund. It follows India’s top 50 companies, has a low expense ratio (often under 0.15%), and has a long track record. I began with the Nippon India Nifty 50 Index Fund. You can also consider Parag Parikh Flexi Cap for a mix of Indian and global equity exposure.
Step 4: Set Your Amount and Date
Choose an amount you can commit to for 12 months without pausing, even during market dips or salary months. I started at ₹500/month because that was my "won't miss it" number. Set the SIP date 3 to 5 days after your salary credit date. Confirm. That’s it—you are now an investor.
Three Mistakes That Kill Most Beginners' SIPs
After talking to hundreds of first-time investors through DareMinds, I keep seeing the same three mistakes.
First, waiting for the right market timing. SIP removes timing as a factor. Stop waiting for a market crash to "enter at the bottom." The whole idea of SIP is that you invest no matter where the market stands today.
Second, starting with too high an amount. A ₹10,000 SIP with a ₹25,000 salary almost guarantees you’ll pause it at the first financial emergency. Start embarrassingly small. Stay consistently invested.
Third, check your portfolio daily. SIP is a long-term strategy, lasting 10 to 20 years. Daily checks can lead to emotional decisions. Set a quarterly review and leave it alone the rest of the time.
Why I Started SIP on ₹25,000-₹30,000/Month and Why You Can Too
I am a lecturer in a college in a Tier-3 city in Rajasthan. There’s nothing extraordinary about my income or starting situation. What changed was my decision to stop thinking that investing was only for people who earn more.
The DareMinds mission is the 0.1% wealth club—a net worth in 18 to 26 years. Not through trading or luck. Through SIP, compounding, content income, and consistent effort.
If my SIP started at ₹500 after losing ₹80,000, yours can start at whatever amount feels comfortable to you right now.
Conclusion: Your One Action for Today
You do not need to understand everything about mutual funds to start a SIP. You just need a PAN card, an Aadhaar, and 20 minutes. That’s all.
Open Dhan or Zerodha today. Complete your KYC. Pick a Nifty 50 index fund. Set a ₹500 SIP. You can increase the amount later, but you cannot get back the time you spend waiting.
Note: I am not a SEBI-registered financial advisor. This is my personal experience. Please consult a qualified professional before investing.