

The rich-life illusion in an Indian tier-3 city: Creta next door isn't wealth. It's a 7-year EMI with a depreciation clock. Here's the correct comparison – and the quiet luxury index for tier-3 India.
Disclaimer: This article contains affiliate links to investment platforms such as Zerodha
and Dhan. We are not SEBI-registered advisors; please consult a qualified financial professional.
The Comparison That Made Me Feel Poor When I Wasn't A Rich Life Illusion
My neighbour bought a new Hyundai Creta in March.
14 lakh rupees ex-showroom. Seven-year loan at approximately 9% interest—monthly EMI: approximately 19,000 rupees.
For approximately two weeks after the Creta appeared in the shared parking, I had a persistent low-grade feeling of financial inadequacy.
My own vehicle -- a 2017 hatchback owned outright -- looked older by comparison. The visible gap in consumption felt like a gap in financial standing.
Then I ran the actual comparison. Not consumption versus consumption -- that comparison is what produces the inadequacy feeling. Balance sheet versus balance sheet -- which is the comparison that tells the truth.
"The feeling of being less wealthy and the reality of having less wealth are two completely different things. One is produced by visible consumption comparison. The other requires a balance sheet."
The Creta Balance Sheet — The Number Most People Never Run — which is a rich-life illusion.
| ITEM | CRETA BUYER (7-YEAR EMI) | MY HATCHBACK (OWNED) |
| Monthly outflow | Rs 19,000 EMI | Rs. 0 (running cost only) |
| Total paid over 7 years | ~Rs 22 L (purchase + interest) | Rs. 0 additional capital outlay |
| Vehicle value at year 7 | ~Rs 3-4 Lakh | ~ Rs 1 Lakh (older) |
| Net asset created | Rs 3-4 L from Rs 22 L spent | Rs. 0 additional expense |
| EMI capital invested in Nifty 50 instead | N/A | Rs 24 L is the same monthly amount for 7 yr, 12% CAGR |
| Net worth difference at year 7 | Baseline | + Rs 21-22 L advantage |
The table's most important row: if the Rs 19,000 monthly EMI were instead directed to a Nifty 50 SIP for 7 years at 12% CAGR, the terminal value would be approximately Rs 24 lakh. The vehicle's value at the same point: approximately Rs 3 lakh.
The wealth difference between the two approaches, measured at the 7-year mark: approximately Rs 21 lakh.
This is not an argument against car purchases. Cars serve real purposes: reliability, safety, productivity, family transport, professional credibility.
The Creta is a sensible family vehicle. The argument is against using the visible quality of someone else's car as a proxy for their wealth. The Creta signals income and expenditure.
It says nothing about net worth, emergency fund, investment history, or insurance coverage.
Why Visible Consumption Is poor wealth compared to rich life Illusion Proxy in India
Thorstein Veblen's concept of conspicuous consumption -- spending to signal status -- was developed in the context of a society where the wealthy could afford to signal status and the non-wealthy could not. The signal had content: visible consumption implied underlying wealth.
Consumer credit has largely invalidated this relationship. EMI financing means that the visible consumption signal can be purchased on credit by anyone with a stable income -- regardless of their actual wealth position.
The person with a new SUV on a 7-year EMI and no emergency fund is making a different financial choice than the person with a paid-off older vehicle and a growing SIP portfolio.
But from the street, they are indistinguishable -- and from the street comparison, the SUV owner appears wealthier.
In tier-3 India specifically, where consumer credit has expanded significantly in the last decade, investment culture has grown more slowly, widening the gap between visible consumption and actual wealth.
The position is particularly wide. The neighbourhood's newest vehicles frequently represent the highest debt loads, not the highest net worths
If that same ₹19,000 monthly outflow were redirected into an index fund via platforms like Zerodha
or Dhan, it would grow into approximately ₹24 lakh at a 12% CAGR over 7 years.
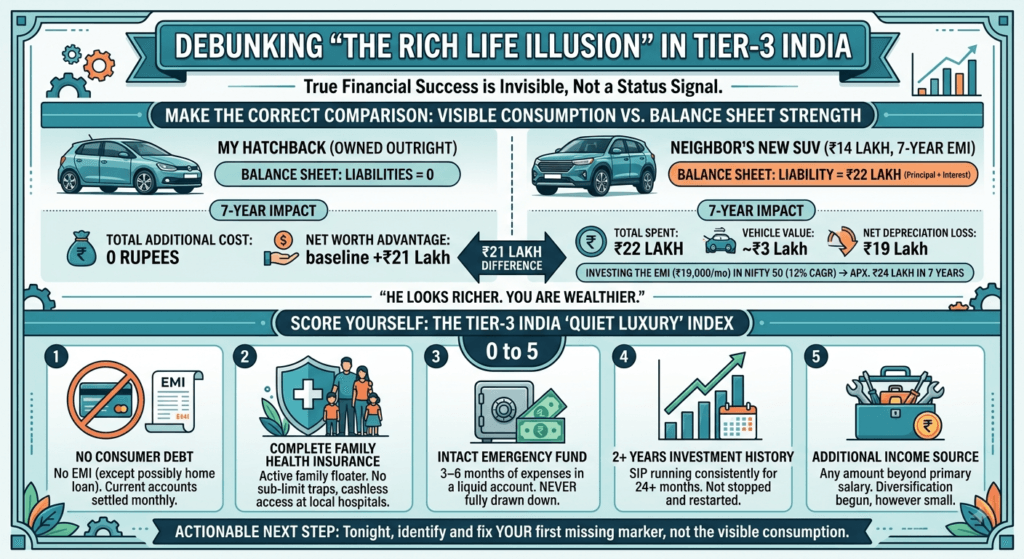
The Rich Life Illusion: Quiet Luxury Index — Five Markers for Tier-3 India
Quiet luxury, in the global personal finance context, refers to the wealth signals invisible to casual observation. In tier-3 India, those signals are specific:
| MARKER | WAHTIT LOOK LIKE | WHAT IT SIGNALS |
| 1. No consumer debt | Zero EMIs (except possibly a home loan); credit card balances cleared monthly | Positive cash flow without consumption leverage. |
| 2. Family health insurance | Active family floater or individual policy with no sub-limit traps or gaps. | Medical emergencies will not wipe out accumulated capital. |
| 3. Emergency fund intact | 3–6 months of living expenses in a liquid account, never fully drawn down. | Short-term financial shocks are absorbed without resorting to debt. |
| 4.2+ years investment history | SIP running consistently for 24+ consecutive months. | Active compounding and established financial discipline. |
| 5. One additional income source | At least one additional income stream beyond the primary salary, however small. | Early diversification and reduced single-employer dependency. |
Score 0 to 5 -- one point per confirmed marker.
| SCORE | POSITION | PRIORITY ACTION |
| 0 | Financial foundation not yet started | Start emergency fund first — any amount |
| 1 | Beginning — one foundational element in place | Health insurance if missing; emergency fund if no insurance |
| 2 | Building — two elements established | Their marker — usually consistent investment history |
| 3 | Stable foundation | Fourth or fifth marker — usually additional income or extended emergency fund |
| 4 | Strong foundation | Optimise existing — increase SIP, extend emergency fund to 6 months |
| 5 | Tier-3 quiet luxury position | Maintain and compound — the foundation is established |
The Creator's Score — Honest Accounting for rich life Illusion
At the time of the Creta comparison, my quiet luxury score was 3.
- Marker 1 — No consumer debt: yes. No EMI, no credit card balance.
- Marker 2 — Health insurance: partial. Individual policy in place, but not a family floater.
- Marker 3 — Emergency fund intact: yes. Four months of expenses, not drawn down.
- Marker 4 — Investment history: yes. SIP running consistently for 18 months.
- Marker 5 — Additional income: early stage. DareMinds' income is beginning but not yet stable.
My estimated score for the Creta neighbour: 1 to 2. Income: yes (one point by definition). Emergency fund: Uncertain -- the Rs 19,000 monthly EMI significantly constrains emergency fund building.
Health insurance: unknown. No consumer debt: no -- the Creta loan is consumer debt. The feeling is that he is wealthier. The score: I am in a stronger position. The Creta is a consumption signal, not a wealth signal.
Recalibrating the Reference Group for the rich life Illusion
The quiet luxury score is useful beyond its function as a self-assessment tool.
It provides a recalibrated reference group -- a way to compare financial positions against dimensions that actually predict long-term wealth rather than current consumption visibility.
The NSSO and PLFS data on Indian household income and wealth distribution provide the broader
Context:
| Monthly Household Income | Approximate Income Percentage | Context |
| < Rs 10,000 | < 40th percentile | Below median — majority of Indian households |
| Rs 20,000 | ~65th percentile | Above median |
| Rs 30,000 | ~75th percentile | Top quarter |
| Rs 50,000 | ~88th percentile | Top 12% |
| Rs 100,000 | ~95th percentile Top | Top 5% |
The reference group visible on social media and in professional networks is not representative of India's income distribution. LinkedIn's feed is populated by the top 5 to 10% of earners -- the Rs 1 lakh+ households.
The neighbour's Creta represents the top 12 to 15% of households by income. Comparing one's financial position to these visible reference points and feeling inadequate is comparing against a systematically unrepresentative sample.
The percentile look-up -- available through NSSO data -- provides the accurate comparison: at Rs With a Rs 30,000/month household income, you are in the top quarter of Indian households by income.
The Creta: The comparison is between one top-quarter household and another.
Neither is 'rich' by global standards. Both are in a strong position by Indian standards. The EMI structure of one does not make it wealthier than the other.
What is your quiet luxury score tonight as a rich-life illusion?
Five questions. One point each.
- Is your current financial position free of consumer debt (no EMIs except possibly a home loan)?
- Do you have health insurance covering yourself and any dependants, currently active, with no
significant gap? - Do you have an emergency fund of at least 3 months of expenses that has not been emptied in the last
12 months? - Have you had a consistent investment (SIP or equivalent) running for at least 24 months without
stopping? - Do you have any income source beyond your primary salary, however small?
Write your score. The first missing marker is your next financial action.
Not the Creta. The marker.
If comparison anxiety is keeping you awake, use the 5-minute financial dump from Why You Wake Up at 3 AM or apply the tactile sleep protocols from Military Sleep Method to clear active memory before bed.